Assignment 9
Due Date
Friday, November 9, 2012
Data Source
The data for this assignment is birdbeetles.txt, a tab-delimited text file.
Background
These data are taken from Carroll (1998) who took the species data from Pearson and Cassola (1992). Pearson and Cassola (1992) subdivided the Indian subcontinent into geographic units using a grid consisting of 61 squares, each 275 by 275 km on a side. When this was not possible because the grid cells fell along the coast or along international borders, squares were established that had areas approximately equal to the other squares. Within each grid cell the numbers of tiger beetle species (beetles) and non-aquatic and non-marine breeding bird species (birds) were determined based on published accounts. The altitudinal relief (relief) of each square was determined from topographic maps. The variables latitude and longitude in the data frame correspond to the geographic centers of the grid cells.
Previous research on the use of bioindicators on the Indian subcontinent suggest that tiger beetle diversity is a useful bioindicator of the number of bird species. Altitudinal relief is also known to correlate with bird diversity. The goal of this exercise is to obtain the best model that relates bird species richness to both tiger beetle richness and altitudinal relief.
Questions
- To model bird species richness as a function of tiger beetle richness and altitudinal relief, fit all of the standard regression models that are commonly used for count data. Your models should include the following.
- ordinary normal model
- Poisson model
- negative binomial model (NB-2)
- negative binomial model (NB-1)
- lognormal model
- square root normal model
- Compare the six models and choose the "best". Explain why you chose the model you did. Summarize your work with a table listing the models, their log-likelihoods, number of estimated parameters, and their AIC.
- Write down the equation for predicted bird richness from your final model. Interpret what the coefficients of the two predictors represent. For example, if beetle richness increases by one unit how does that affect the predicted bird richness? What summary measure of bird is richness is being predicted by your final model?
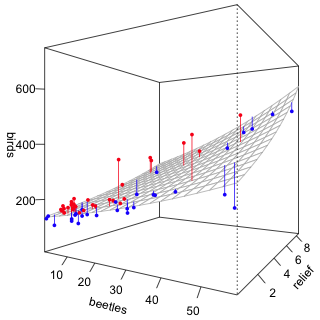
- Display your best model as a three-dimensional surface plot. Add the raw data to this plot. To provide perspective drop a perpendicular from each plotted point to the regression surface. Color code the plotted points so that points lying above the surface are red and points lying below the surface are blue.
- Check the goodness of fit of your final model. (Additional hint added 11/6/12.)
- Plot the geographic coordinates of the grid cells. Using your final model, color code the plotted points so that observations with positive model residuals are colored red and observations with negative model residuals are colored blue. Does the plot suggest any potential problems with your final model? What?
Hints
- Here's the kind of graph I'm looking for in Question 4.
- For assessing goodness of fit follow the protocol outlined in lecture 21. There are 61 grid cells so trying to display them all as a single page of panel graphs can produce an awfully busy graph. Using the layout argument of xyplot we can select a subset of the panels to appear on a single page thus causing the entire panel graph to appear on multiple pages.
- In Mac OS X under the Quartz menu the Forward and Back commands allow you to move back and forth in the current window to see the different pages.
- In Windows when the graph window in R is selected a History menu will appear at the top of R window. If you choose History > Recording the graphs you create from that point on will be stored as multiple pages in the graph window. To navigate to these pages use the PgUp and PgDn keys on the keyboard. You can then save each of the individual pages of the multi-page panel graph.
Issuing the command par(ask=T) before you create the lattice graph will force R to wait for the <Enter> key to be pressed before displaying the next graph. This allows you to display multi-page graphs one page at a time. In Mac OS X the currently displayed graph can also be saved.
Cited references
- Carroll, Steven S. 1998. Modelling abiotic indicators when obtaining spatial predictions of species richness. Environmental and Ecological Statistics 5: 257–276.
- Pearson, D. L. and F. Cassola. 1992. World-wide species richness patterns of tiger beetles (Coleoptera: Cicindelidae): Indicator taxon for biodiversity and conservation studies. Conservation Biology 6: 376–391.
Course Home Page