Count Regression Models
Data
The file islands.txt contains the data appearing in McMaster (2005). This is a comma-delimited text file in which the variable names appear in the first row.
Background
McMaster (2005) examined native and non-native plant species richness on 22 islands off the coast of the northeastern United States and maritime Canada and studied its relationship to various geographic factors. For this exercise we will focus on only two variables.
- Species richness (sp.richness)
- Island area (island.area)
The Problem
Fit the following five models to the variable species richness S as a function of island area A.
- Gleason model:
 with identity link such that
- Arrhenius model: with identity link such that

- Log-Arrhenius model:
 with identity link such that
 - Poisson GLIM:
 with log link such that
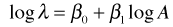
- Negative binomial GLIM:
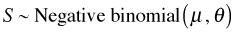 with log link such that
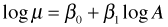
In all models β0 and β1 are parameters to be estimated. In the normal models an additional parameter σ2 needs to be estimated, while the negative binomial model has the dispersion parameter θ to be estimated. The Poisson model has no additional parameters. Observe that models 1 and 3 can be fit as ordinary regression models (general linear models), model 2 is a nonlinear model (fit using nonlinear least squares), and models 4 and 5 are generalized linear models proper.
For each model,
- Report the fitted equation you obtain.
- Graph the fitted equation superimposed on a scatter plot of the data. You may include more than one model on the same scatter plot when it's appropriate.
- Finally compare all five models and determine which is (are) best for these data.